Observability Blueprint: Three Layers, One Graph
This is the implementation guide for the unified observability executive insight (Building a Unified Observability Framework, draft in local dev). That piece explains why siloed monitoring fails. This blueprint explains what to build: three layers, one observability graph, four capability planes, and a maturity path from reactive logs to business-aware operations.
A production observability stack connects business KPIs to service traces and infrastructure signals through correlation IDs and journey mapping. Dashboards consume the graph; they do not replace it.
What you are building
A unified observability framework is six connected capabilities:
- Business journey map: KPIs and SLAs tied to named workflows, not orphan metrics
- Service instrumentation: Golden signals, distributed traces, dependency graph, SLIs/SLOs
- Infrastructure telemetry: Resource and platform health linked to service identities
- Observability graph: Correlation from KPI → transaction → resource
- Capability platform: Collection, correlation, intelligence, action layers
- Operating model: Shared ownership across product, engineering, platform, SRE, architecture
Read the top row left to right: Business → Service → Infrastructure, then down through the observability graph and capability platform.
The observability graph
The graph is the unifying artifact. It answers: when this KPI moved, which service transactions and which infra resources moved with it?
| Node | Carries | Example |
|---|---|---|
| Business event | Journey step, outcome, principal | checkout.payment.failed |
| Service span | Operation, dependency, latency, error | POST /payments → fraud.check |
| Infra signal | Resource binding | db-primary.cpu, pool.connections |
Example flow: payment success drop
| Layer | Observation |
|---|---|
| Business | Payment success rate 98% → 85% on checkout journey |
| Service | Payment API p95 latency up; fraud service timeouts; retry storms |
| Infrastructure | Database CPU 95%; connection pool exhaustion |
One incident narrative. No manual portal hopping.
For agent and RAG paths, service spans must include gateway, policy, retrieval, model, tool, and validation hops. See G.A.I.N Observability and AI Observability in Enterprise. The graph shape is the same; the span set is richer.
Capability model
Think in capabilities, not tools.
| Capability | Owns | Does not own |
|---|---|---|
| ① Data collection | Metrics, logs, traces, business events at source | Dashboard layout |
| ② Correlation | Trace IDs, journey mapping, dependency graph | Alert routing rules alone |
| ③ Intelligence | Anomaly detection, SLO burn, trend analysis | Runbook content |
| ④ Action | Runbooks, incident automation, remediation hooks (mature) | Business KPI definitions |
Reference architecture (conceptual)
| Stage | Regulated-enterprise default |
|---|---|
| Sources | Structured logs, OTel traces, business event bus, infra agents |
| Pipeline | Enrichment with service identity, tenant, journey ID; redaction before persistence |
| Platform | Separate tiers for ops, quality, and audit retention |
| Intelligence | SLO burn-rate alerts, dependency-aware anomaly, business KPI thresholds |
| Consumption | SRE dashboards, product journey views, regulator replay exports |
Maturity model
Observability is not binary. Use this ladder to plan investment.
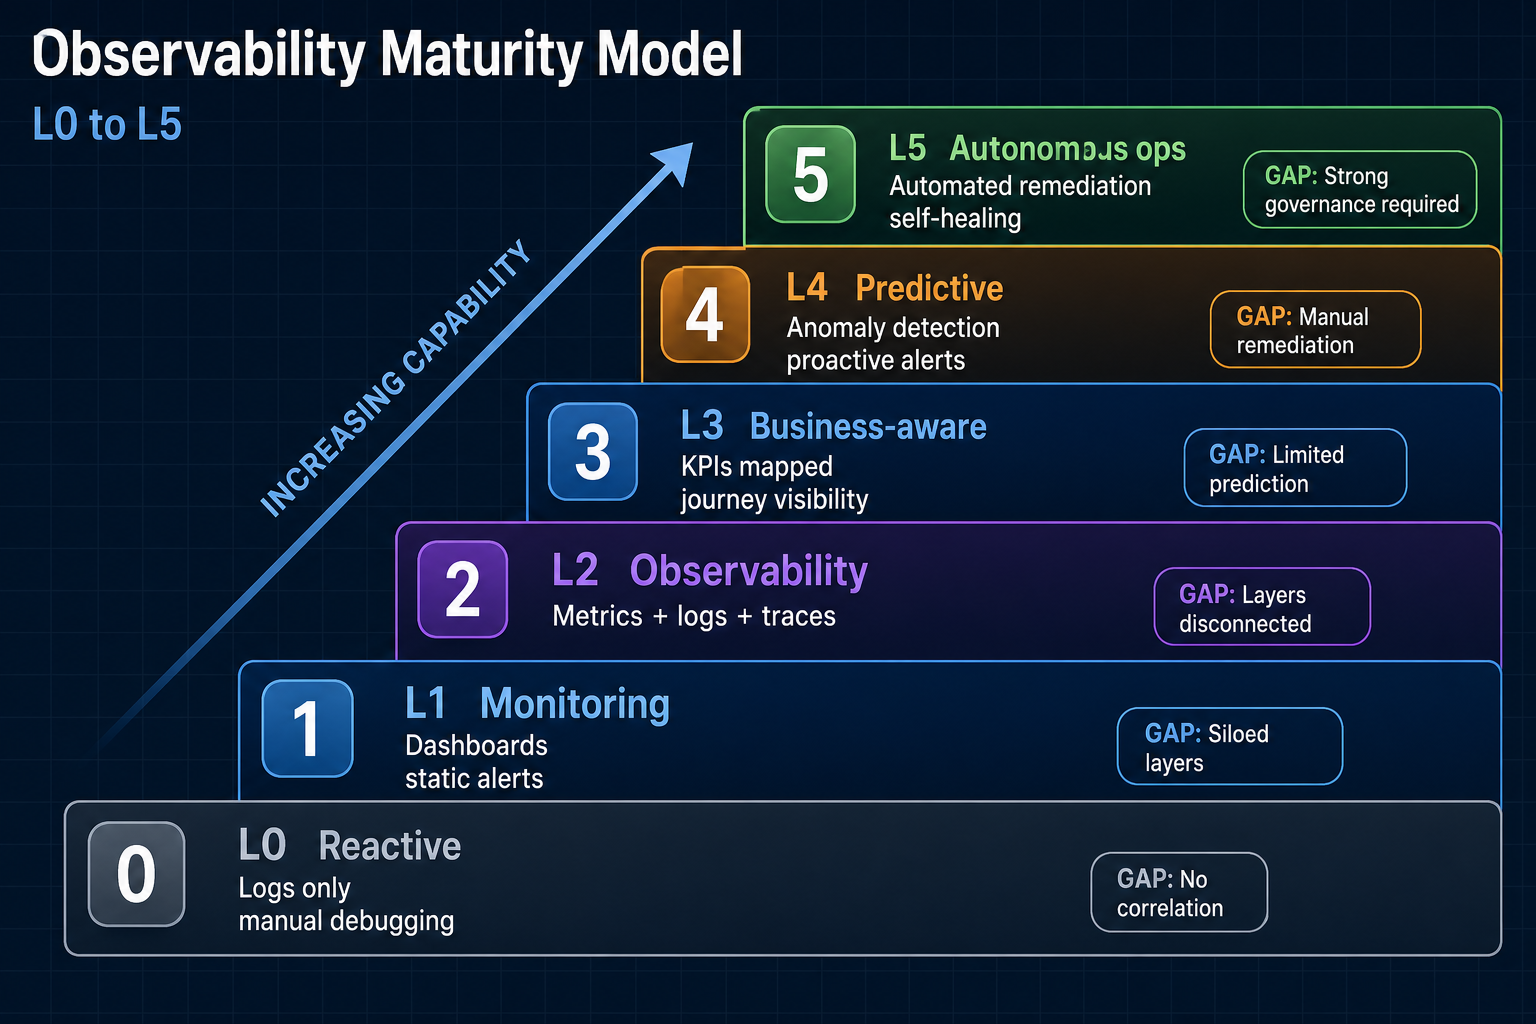
Most firms should reach L3 broadly (business-aware, correlated graph) and L4 on tier-1 journeys before attempting L5. Autonomous remediation needs governance, audit trails, and blast-radius controls first.
| Level | Name | Characteristics | Typical gap |
|---|---|---|---|
| 0 | Reactive | Logs only, manual debugging | No correlation |
| 1 | Monitoring | Dashboards, static alerts | Siloed layers |
| 2 | Observability | Metrics + logs + traces | Layers still disconnected |
| 3 | Business-aware | KPIs mapped to services, journey visibility | Limited prediction |
| 4 | Predictive | Anomaly detection, proactive alerts | Manual remediation |
| 5 | Autonomous ops | Automated remediation, self-healing (select paths) | Requires strong governance |
Assessment playbook: Maturity assessment.
Design principles (governance rules)
| Rule | Rationale |
|---|---|
| Every service emits structured logs | Parsing cost and alert quality |
| Every request carries a correlation ID | Graph integrity |
| Every business KPI maps to system signals | Business-aware prioritization |
| Every alert has an owner and action | No orphan pages |
| Every dashboard answers a decision question | Prevents sprawl |
| No telemetry without purpose | Cost and compliance |
Playbook: Governance rules.
Operating model (summary)
| Role | Owns |
|---|---|
| Product | Business KPIs, journey definitions, outcome SLOs |
| Engineering | Service instrumentation, SLIs, dependency accuracy |
| Platform | Observability infrastructure, pipelines, retention tiers |
| SRE / reliability | Alerting, incident response, error budgets |
| Architecture | Standards, correlation model, maturity roadmap |
Playbook: Operating model.
Playbook map
| Layer / topic | Playbook |
|---|---|
| Business journeys | Business journey mapping |
| Service golden signals | Service golden signals |
| Infrastructure | Infrastructure telemetry |
| Correlation graph | Correlation graph |
| Governance | Governance rules |
| Maturity | Maturity assessment |
| Ownership | Operating model |
Start at Observability playbooks overview.
Related G.A.I.N domains
| Domain | Relationship |
|---|---|
| G.A.I.N Observability | AI service-layer depth: capture, retention, audit |
| G.A.I.N Evaluation | Quality and drift consumers of telemetry |
| PGAR audit and replay | Policy verdict chain as audit-tier signal |